
Enterprise VR Training

VR Training ROI: How to Build the Business Case and Measure Outcomes

Two executives reviewing a VR training analytics dashboard on a large display in a dark boardroom

Every enterprise L&D team considering VR training eventually runs into the same problem: the initial pilot looks amazing, scores high on satisfaction, and then dies at budget renewal because no one can say what it actually achieved. This is the single most common way VR training programs fail — not because the content is bad, but because the measurement framework was built after the fact, or not at all.

This post is our playbook for measuring VR training ROI in 2026 — the metrics that matter, the ones that don't, and the infrastructure decisions you need to make before the first scenario ships, not after.

We write it from the position of having built VR training programs for banking (NBK Virtugate), transport (Empathy Lab for UK rail), healthcare (Reahap physical rehab), and national education (the RSA road-safety platform adopted into the Irish national curriculum). The measurement patterns below work.


The Three-Tier Metric Model

Not all metrics are ROI metrics. Understanding the hierarchy is the first thing that separates programs that survive budget review from programs that don't.

Tier 1 — Engagement metrics. Completion rate, time-in-headset, session frequency, opt-out rate, post-training survey satisfaction score. These tell you whether learners showed up and did the work. Vendors over-index on these because they are easy to report and always look good. They are necessary (a program with 40% completion is clearly failing) but not sufficient. An engagement metric by itself does not justify a budget.

Tier 2 — Learning metrics. Scenario pass rate, time-to-decision on critical events, correct action sequence rate, gaze attention on high-consequence elements, comparison of in-scenario performance to defined benchmarks. These tell you whether the training is actually teaching anything. Tier 2 metrics are the most valuable for content iteration — they are how you make scenario 2 better than scenario 1 — but business sponsors don't understand them without translation.

Tier 3 — Business metrics. Field incident rate, customer escalation rate, time-to-competency, close rate, compliance rate, safety inspection score, customer Net Promoter Score. These are the metrics your business already tracks. They are the only metrics that justify the program at budget time.

A defensible VR training program measures all three, but the business case lives entirely in Tier 3. Tier 1 keeps the lights on during development; Tier 2 improves the content over time; Tier 3 gets you next year's budget.


How to Pick the Tier-3 Metric

The Tier-3 metric should meet four criteria:

  1. Your business already measures it. Not a new metric you invent for this program. If workplace incident rate is tracked monthly by operations, that is your candidate. If customer escalation rate is tracked by the support org, that is your candidate.
  2. It is sensitive to the behavior the training addresses. Empathy training should move customer escalation and NPS. Safety training should move incident rate. Compliance training should move audit pass rate.
  3. It is measured on a time horizon you can afford. 30-day, 90-day, and 180-day windows are normal. Metrics that only change annually are hard to evaluate for a VR pilot.
  4. You can access a dollar value per unit change. Finance usually already has this — cost per workplace incident, revenue impact of a 1-point NPS shift, cost of a customer escalation. If the dollar translation doesn't exist, ask finance to estimate it before you scope the training.

Write the target as a single sentence before you speak to any vendor:

"We want to reduce our field incident rate from 12 per 10,000 work-hours to 8 per 10,000 work-hours within 90 days of VR safety training rollout for the 1,200 operator population, saving an estimated $X per avoided incident."

That sentence makes every downstream decision easier.


The Baseline Measurement Problem

Most corporate VR training programs fail to measure baseline properly. The pattern we see: a team commits to VR training, rushes through the procurement, deploys the pilot, and then starts thinking about "how do we know if this worked?"

By that point the baseline is gone. The 90-day pre-training window closed weeks ago, and the field data for it was either not captured at all or not segmented by the cohort that received the training.

The fix is procedural, not technical:

  • Freeze the baseline window before the program kickoff. 90 days is usually enough; 180 is better for noisy metrics.
  • Identify the exact learner cohort. Named employees, not "everyone in operations." The cohort analysis needs the list.
  • Capture the baseline field metric value for that exact cohort. Not the company average. Not last year's average. The 90-day value for the specific 50–500 people who will go through the training.
  • Record the confounders. What else is happening to this cohort in the same window? Management change, process update, new policy, seasonal shift? Note them so the post-program analysis can address them.

This work costs about a week of L&D analyst time. It is the highest-leverage week in the entire program.


Scenario-Level Telemetry: What to Capture

Inside the headset, the analytics layer should capture behaviors that map to your learning objectives. Generic "time in scenario" data is not enough.

Practical schema we ship for enterprise VR training programs:

event: scenario_start
event: critical_decision
  scenario_id: emergency_evacuation_warehouse_3
  decision_point: unauthorized_exit_observed
  response: alert_supervisor | wait | approach_subject | call_security
  time_to_decision_ms: 4280
  correct_response: alert_supervisor
event: gaze_target
  target_id: emergency_exit_sign
  focused_ms: 1850
  required: true
event: scenario_complete
  passed: true | false
  completion_time_ms: 412000
  correct_decisions: 4
  total_decisions: 5

This schema gives L&D teams the data to:

  • Identify which decisions learners get wrong most often (fix those scenarios first)
  • See whether learners look at the critical cues (gaze attention) — if they don't, the scenario design isn't working
  • Measure time-to-decision on stress events — a common proxy for genuine preparedness
  • Spot cohort-level patterns (night-shift operators take longer on decision X than day-shift — relevant field insight)

Specify this schema before scoping the VR build, not after. Retrofitting scenario telemetry into a shipped Unity build is an expensive rewrite, not a config change.


Translating Scenario Data to Business Outcome

The bridge from Tier 2 to Tier 3 is not automatic. Two patterns work in practice:

Pattern A — Direct behavioral correlation. If your scenario measures "time to alert supervisor on unauthorized exit" and your field metric is "workplace security incident rate," the scenario data is a proxy for field behavior. The analytical claim is: "Learners who pass the scenario's decision point within 5 seconds are Y% less likely to experience a field security incident." Require a correlation study (often 6–12 months of paired scenario + field data) to confirm the link.

Pattern B — Pre/post field measurement with controls. Easier to set up, weaker causal claim. Measure the Tier-3 metric for the training cohort for 90 days before training, train them, measure the same metric for 90 days after, use a matched untrained cohort as control. Useful for convincing finance but less satisfying to L&D researchers.

Most enterprise VR training programs we deliver settle on a hybrid: Pattern B for the business case at budget time, Pattern A for the content iteration loop over the program's lifetime.


What ROI Benchmarks Should You Expect?

The model above tells you what to measure. These are the published benchmarks to measure against.

1. What are the top immersive training ROI benchmarks?

Enterprise immersive training ROI is measured across four primary dimensions: speed, retention, cost efficiency, and business impact. Each dimension produces a distinct benchmark that finance teams can validate against pre-program baselines.

Speed. VR training achieves 3x to 4x faster learning speeds compared to classroom instruction. Walmart's Pickup Tower onboarding dropped from 8 hours to 15 minutes using VR. That 96% reduction in training time converts directly into labor cost savings and faster time-to-productivity for new hires.

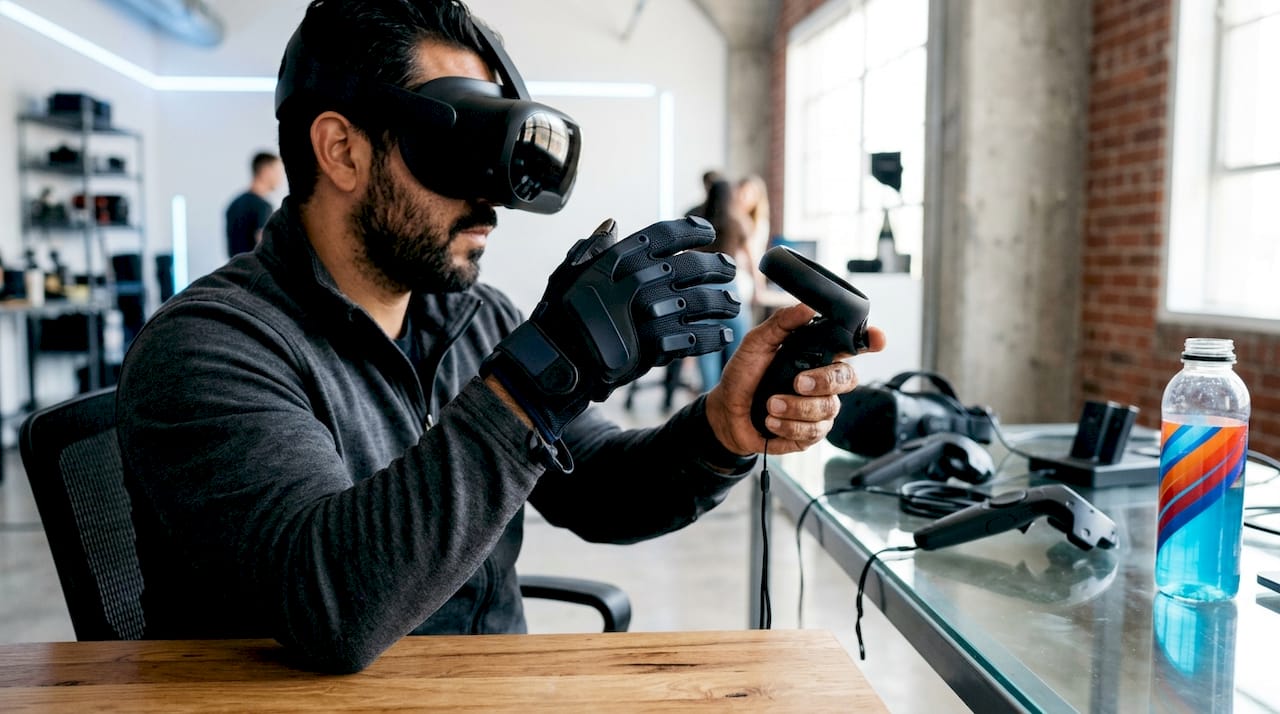
Hands operating VR training equipment

Retention. Immersive learning produces retention rates of 75% versus roughly 10% for traditional classroom formats. Higher retention means fewer repeat training cycles, lower remediation costs, and faster competency attainment at the individual level.

Cost efficiency. At scale, VR training costs 52% less than classroom delivery for cohorts of 3,000 learners. The cost advantage grows as deployment size increases, which makes the economics particularly compelling for large enterprises.

Business impact. Walmart's VR program increased employee satisfaction by 30%, test scores by up to 10%, and retention by 10%. Boeing and similar manufacturers track error reduction rates and onboarding speed as primary financial proxies for training ROI.

Pro Tip: Collect at least 90 days of pre-training performance data before launching any immersive program. Without that baseline, efficiency gains are routinely dismissed by finance as noise rather than program outcomes.

2. How does immersive marketing ROI compare to traditional advertising?

Immersive marketing ROI benchmarks consistently outperform static and standard digital formats across conversion, engagement, and ad spend efficiency. The gap is large enough to be strategically significant rather than marginal.

DTC brands using AR and 360-degree content report a 612% increase in ROAS compared to static ad creative. AR product demos convert at 4.8x the rate of traditional formats. These figures reflect the attention and interaction depth that immersive formats generate, which static imagery cannot replicate.

Experiential and immersive events also outperform standard digital advertising at the campaign level. Experiential events achieve a 38% success rate compared to 19.7% for digital ads. Average event marketing ROI sits between 25–34%, and immersive formats regularly double that baseline.

ChannelConversion BenchmarkROI Range
Static digital adsBaseline19.7% success rate
Experiential events1.9x static25–34% average ROI
AR product demos4.8x static612% ROAS uplift
Immersive VR brand events2x+ digitalExceeds event average

Pro Tip: Map every immersive marketing KPI to a downstream business outcome. Dwell time and social shares are useful signals, but conversion rate and net promoter score are what CFOs and CMOs will act on.

3. What operational ROI benchmarks do immersive applications deliver?

Operational ROI from immersive technology is most clearly demonstrated in maintenance, assembly, and quality control contexts. The benchmarks here are expressed in time savings, error rates, and cost avoidance rather than learning metrics.

AR in retail reduces product returns by 36% in fashion categories. That figure translates directly into reverse logistics cost savings, reduced restocking labor, and improved customer lifetime value. For a mid-size retailer processing thousands of returns monthly, the financial impact is material.

In industrial settings, assembly time reductions of 19–40% are well documented. Fujitsu cut average assembly time from 120 to 97 minutes using AR-guided workflows. GE Aerospace achieved 20–40% reductions in training time for complex assembly procedures. Both cases demonstrate that immersive guidance reduces cognitive load, which in turn reduces errors and rework.

Key operational benchmarks to track include:

  • Mean Time to Repair (MTTR): A direct financial proxy for maintenance efficiency gains from AR-assisted troubleshooting.
  • First-time fix rate: Measures whether technicians resolve issues correctly on the first attempt, reducing repeat dispatch costs.
  • Assembly error rate: Tracks defect frequency before and after immersive guidance implementation.
  • Training time per certification: Quantifies speed gains for compliance-critical skill acquisition.

Finance teams prefer hard operational data like downtime avoidance and quality logs over engagement metrics. MTTR and first-time fix rate provide the credible financial proxies that operational ROI cases require.

4. How do ROI economics scale with immersive deployments?

Scaling immersive programs fundamentally changes the cost structure. The per-learner economics improve steeply as deployment size grows, which makes scale a primary driver of total program ROI.

  1. Below 375 learners: VR training costs more per learner than classroom delivery. Hardware amortization and content development costs dominate at small cohort sizes.
  2. At 3,000 learners: VR training becomes 52% cheaper than classroom methods. Travel elimination, instructor time reduction, and facility cost avoidance drive the crossover.
  3. At 10,000 learners: VR training costs 64% less than traditional delivery. The marginal cost per additional learner approaches near zero once content and infrastructure are in place.
  4. Total cost accounting: Accurate ROI modeling must include travel, instructor salaries, facility downtime, and lost productivity during training. These hidden costs frequently make classroom training 2x to 3x more expensive than the direct training budget suggests.
  5. Walmart and Bank of America both demonstrate that large-scale VR deployments generate compounding returns. Walmart deployed VR across more than 4,700 US stores. The per-store cost dropped significantly as the program scaled, while consistency of training outcomes improved.

CFO skepticism about immersive ROI is almost always rooted in incomplete cost comparisons. Building a total cost of ownership model that captures indirect classroom costs is the single most effective way to shift the financial conversation.

5. Immersive experience ROI benchmarks across use cases

The table below consolidates the primary benchmarks across training, marketing, and operations. These figures represent current enterprise-grade data from Forrester, PwC, and published case studies.

Use CaseROI BenchmarkKey MetricLeading Example
Enterprise VR training219% over 3 yearsTime-to-competency, retentionWalmart, Boeing
AR marketing campaigns612% ROAS upliftConversion rate, ad spend efficiencyDTC brand deployments
Immersive events25–34% average ROIEvent success rate (38%)Experiential marketing programs
AR-guided assembly19–40% time reductionMTTR, assembly error rateFujitsu, GE Aerospace
AR retail (returns)36% return reductionReverse logistics costFashion retail deployments
Safety training (XR)90% cost reductionEngagement rate, incident frequencyAlstom

Immersive learning boosts employee engagement by 5x and reduces safety training costs by 90%, as demonstrated by Alstom's deployment. That combination of engagement and cost reduction is the clearest argument for treating XR as workforce infrastructure rather than a pilot technology.

The sectors with the fastest ROI realization are safety-critical training and AR-assisted maintenance. Both generate measurable outcomes within the first deployment cycle because the baseline costs they replace are high and the performance gaps they close are large.

Common Measurement Mistakes

These show up in almost every dead pilot we see.

Reporting satisfaction scores as ROI. A program with 4.8/5 learner satisfaction and zero business-metric movement is delivering a perk, not training. Don't report engagement metrics as though they justified the budget — they don't, and procurement knows it.

Measuring completion rate only. Completion is binary and ceiling-capped. A 95% completion rate tells you the rollout logistics worked; it tells you nothing about whether anyone learned anything.

No control group. Pre/post measurement without a control cohort is weak evidence. Any confounding event during the training window (new manager, policy change, seasonal effect) can be blamed for the result. If you cannot run a control, acknowledge the limitation upfront in the business case.

Over-fitting scenarios to the metric. If learners know the VR training is being used to measure their performance on a specific behavior, and they game the training to look good, you have contaminated both the training value and the measurement. Keep the field measurement window genuine.

Ignoring the rollout population drift. If the VR training is delivered to new hires as part of onboarding and the pre-training baseline is measured on veteran employees, you are measuring cohort differences, not training effect. Control for tenure and role.


A Worked Example — Empathy Lab for UK Rail

Our Empathy Lab VR training program for the UK rail sector targeted transport staff empathy and de-escalation skills. The measurement framework:

  • Tier 3 business metric: customer-incident severity rating and post-incident complaint rate, already tracked by the operator
  • Tier 2 scenario metrics: time-to-de-escalation, choice of empathy-language options at critical decision points, post-scenario reflection accuracy
  • Tier 1 engagement: completion rate across the cohort, post-session comfort rating
  • Baseline window: 90 days pre-training for the specific staff cohort
  • Control cohort: matched staff at depots not yet in the rollout

The client's internal feedback: "Putting staff through the VR scenarios changed the vocabulary we hear back in the control room. People describe passenger incidents differently afterwards — that's exactly the shift we were trying to train for."

That quote is what a well-measured VR training program looks like at year-end: a business sponsor able to describe the specific behavioral change the program produced.


The Measurement Budget Line

When you scope a VR corporate training program, the measurement infrastructure is a discrete line item, not a free byproduct. Realistic 2026 costs:

  • xAPI/SCORM export and basic completion tracking — included in any competent build
  • Scenario-level behavioral telemetry (custom events per scenario) — $8–20k per scenario for initial implementation
  • L&D analytics dashboard (custom) — $15–40k for a production dashboard
  • Pre/post cohort analysis by internal team — 2–4 weeks of L&D analyst time per cohort
  • Statistical control for a rigorous ROI claim — another 1–2 weeks of analyst time, or external research partner if the budget supports it

Budget 10–20% of the total program cost for measurement infrastructure. Programs that skip this line ship on time but can't prove what they achieved.


If You Are Starting From Zero

A pragmatic sequence for building the first corporate VR training program with a defensible ROI story:

  1. Pick the Tier-3 metric first. Workplace incident rate, NPS, escalation rate, time-to-competency — whatever your business already tracks that the training should move.
  2. Write the outcome hypothesis in one sentence. Specific cohort, specific behavior, specific time horizon, specific dollar value per unit change.
  3. Freeze the baseline window. 90-day pre-training data for the exact cohort.
  4. Scope the VR training build with measurement infrastructure included. xAPI export, scenario telemetry schema, L&D dashboard.
  5. Define the pilot cohort and control cohort. Named employees. Keep them honest — no swapping between groups.
  6. Deploy, measure at 30/60/90 days post-training. Watch both field metric and scenario-level telemetry.
  7. Report the number. Behavior change × dollar value × population, minus program cost, over program cost.

If you want help setting this up without re-learning every trap we have already hit, book a free scoping call. We will sit with your L&D analyst and build the measurement plan before we scope a line of code.


Frequently asked questions.

How do you actually calculate ROI on a corporate VR training program?
Pick one field metric your business already tracks (workplace incident rate, customer-escalation rate, time-to-competency, close rate), measure it for 90 days before the VR training program, deploy the program to a defined cohort, measure the same metric for 90 days after. ROI is (value-per-unit × change-in-metric × affected-population) minus total program cost, divided by total program cost. Most corporate VR training ROI studies in 2024–2026 report 300–700% payback on 3-year horizons when this method is used rigorously, but the range is wide because the underlying business context varies.
Which metrics should we track in a VR training program?
Three tiers. (1) Engagement metrics — completion rate, time-in-headset, opt-out rate — these are necessary but not sufficient and vendors over-emphasize them. (2) Learning metrics — scenario pass rate, time-to-decision, correct action sequence, gaze attention on critical elements — these tell you whether the training works. (3) Business metrics — incident rate, customer NPS, time-to-competency, escalation rate — these are the only metrics that justify the budget. Programs that only report tier 1 get cut at renewal.
How long before we see VR training ROI?
Behavior change is visible in field metrics within 30–90 days of training completion for most use cases. Full ROI payback depends on the per-learner program cost and the dollar value per unit of behavioral change, but typical published enterprise case studies report payback in 6–18 months for training populations of 500+. For small populations (under 100 learners) payback is harder and may not be the right framing — focus on the outcome quality instead.
What level of analytics do we need in the VR training build?
At minimum: SCORM or xAPI export of completion, score, scenario ID, and time-in-scenario to your LMS. Production programs should also capture scenario-level behavioral telemetry — what decisions the learner made at each critical juncture, gaze attention heatmaps, time-to-decision on stress events. This data is what lets L&D iterate scenarios and what gives business sponsors the narrative for budget renewal. Specify the analytics schema before scoping the build — retrofitting is 2–3× more expensive.
Can you measure VR training ROI against traditional classroom training?
Yes, but you need a control group and matched cohort analysis. The easiest defensible setup: take two similar incoming employee cohorts, train cohort A in VR, train cohort B in classroom, measure the same business metric for both over the same 90-day window. If you cannot run a controlled comparison, you can still measure pre/post for the VR cohort, but expect budget reviewers to discount the result.
What is the single biggest mistake in measuring VR training ROI?
Treating completion rates and learner satisfaction scores as ROI. Both are engagement proxies. A program with 95% completion and 4.8 satisfaction that doesn't move your field metric is not delivering ROI — it's delivering an employee perk. Measure the business outcome, not the learning experience.
  • VR Training ROI
  • Business Case
  • Enterprise VR
  • L&D Metrics
  • Immersive Training Solutions
  • VR Analytics
Mohamed Essam
Mohamed Essam
Co-Founder & CTO

Co-founder and CTO of Virtual Verse Studio. Leads technical direction and client delivery, with deep hands-on expertise in Unity, Unreal Engine, AR/VR, multiplayer systems, and XR architecture — shipping immersive products since 2018.

Keep reading

Related articles.

Build with us

Interested in building something like this?

From VR training to WebGL experiences and beyond — tell us about your project and we'll scope it honestly: timeline, budget range, and the right platform.